European agricultural production
Does the European Agricultural Production under +2°C global warming has significant impacts?
Key messages:
- In a +2°C world, agricultural production is expected to increase on average by 30% in Europe compared to year 2000
- At national scale, climate change and adaptation are very strong determinants of future production levels, and induce large production reallocations
- At European level, production remains primarily driven by the growing demand for food and by crop yields increases from R&D, only slightly moderated by an overall negative climate change impacts on crop yields
The role of socio-economic scenarios
Climate is only one of the determinants of future European agricultural production. The demand for agricultural products is expected to increase with global population growth and a growing share of disposable income. In addition, global trade of agricultural products will increase and continuing research and development efforts will help to increase agricultural yields. As yet another factor influencing future agricultural yield, it is important to understand how a changing climate will contribute to changes in crop production, in comparison to all other drivers of change.
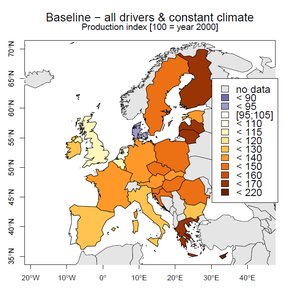
Global temperature increases by 2°C in the 2050-2060 decade on average across IMPACT-2C scenarios. By that time the production of calories from European cropland would increase by 36% on average compared to the year 2000, if climate remains constant. As illustrated in Figure 1, almost all countries will see their production increase, while in relative terms the increase will be larger in Eastern and Northern Europe, as well as Greece, Cyprus and Malta.
The relative weight of climate without adaptation
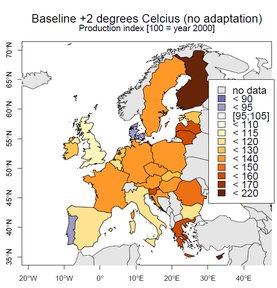
On average, a +2°C climate change would decrease the yield of crops of about -3.7% at the European scale. If we assume no adaptation takes place, this translates directly into production losses: the production index would increase only by 31% relative to year 2000 (instead of +36% under climate constant). As illustrated on Figure 2, average impact on yields will be negative in most countries but slightly worse in Baltic and South-Eastern countries of Europe, and slightly better in a few countries (Finland, UK, Belgium, the Netherlands, and Slovenia).
Overall, the general evolution of agricultural production index and its spatial patterns are relatively equivalent to the case climate effects are not accounted for (see Figure 3). In a +2 °C world, impacts from climate change on yields remains small compared to the socio-economic drivers, if we assume no adaptation.
The role of adaptation
Yield losses can be counteracted at the farm level by changing management practices but also switching between crops differently affected. Imports can buffer production losses while consumers can also adjust. In addition, these are also affected by changes in competitiveness across countries inside and outside Europe (in this project, no climate change impact is considered outside Europe).
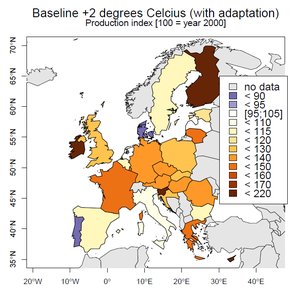
Larger reliance of Europe on imports will be the major adaptation, while consumption is not affected. European production index increases by +30% compared to the year 2000, if accounting for adaptation. This is lower than without adaptation (+31%) and in the baseline (+36%): European farmers lose competitiveness and adaptation even slightly increases production losses. At the aggregated level, climate change has an overall negative impact on European production (even with adaptation), but remains a relatively small driver of total production compared to socio-economic assumptions.
However, as seen in Figure 4, the impact on the production index is much more contrasted across European countries if accounting for adaptation. Negative impacts are stronger in most countries, while impacts are reversed in countries such as UK, France and the Netherlands. As illustrated in Figure 5 (to be compared with figure 1), the patterns of production index are very different than under the baseline: increases are more concentrated in Mid-Western Europe UK, and Ireland (where they are stronger), and lower in Scandinavian countries (except Finland), Eastern and Southern Europe countries. Climate change is thus as important as other drivers for the evolution of production at national level, if adaptation is included.
Additional information
Author:
David Leclere
International Institute for Applied Systems Analysis (IIASA), AustriaReferences:
Reference


![Figure 2: Impact of climate-change related losses in crop yields on the production index [% change relative to the baseline] in a +2°C world, assuming no adaptation. Figure2.png](/media/filer_public_thumbnails/filer_public/90/75/90759024-8168-4306-905a-e0edd7c3b38a/figure2.png__417x288_q85_subsampling-2.jpg)


![Figure 4: Impact of climate-change related losses in crop yields on the production index [% change relative to the baseline] in a +2°C world, assuming producers, trade and consumers adapt. Figure4.png](/media/filer_public_thumbnails/filer_public/4d/d9/4dd91059-2172-40b4-8a80-911b2ed72e62/figure4.png__417x288_q85_subsampling-2.jpg)


