Gross Hydropower Potential
Why is the content of this map important?
Hydropower is the third largest energy source globally and the main renewable energy source. In the coming decades, the increasing share of intermittent renewable energies (mainly solar and wind) in the electricity mix will make the electricity supply-demand balance more challenging. Due to its adjustable nature, hydropower will play a key role in achieving this supply-demand balance.
Which sectors are affected by this result?
The hydropower sector, and the electricity sector as a whole, may be affected by changes in the gross hydropower potential.
What is shown on the maps?
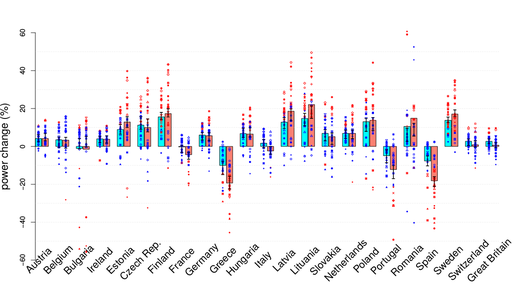
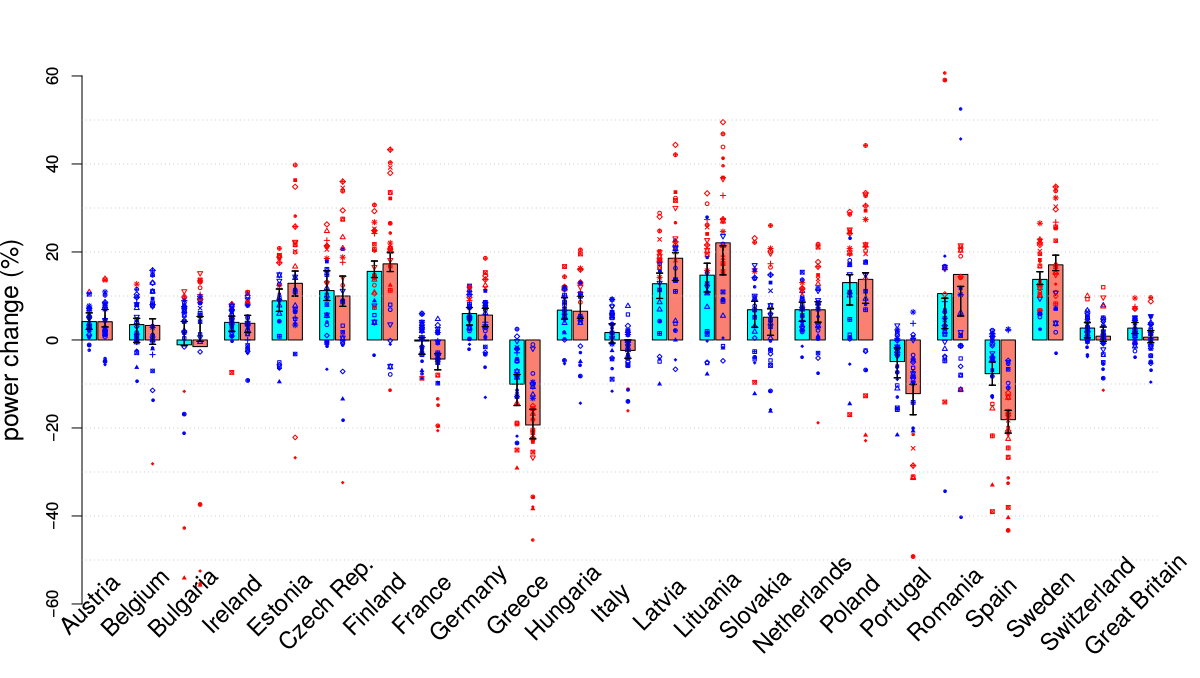
Northern and northern-eastern European countries will be positively impacted by climate change with regard to gross hydropower potential: increases in annual mean gross hydropower potential by 10% to 20% are projected. Gross hydropower potential will hardly vary in some countries such as France and Great Britain. Southern countries, especially the Iberian Peninsula and Greece will undergo a decrease in gross hydropower potential by 5-10%.
Details and further information:
The assessment is based on five hydrological models combined with five climate simulations. On average over the model ensemble, a 3°C global warming leads to similar changes compared with a 2°C warming for a number of countries but can enhance changes by a factor of 2 for several other countries (see additional figure). The spread among models is substantial with some models projecting change magnitudes (decreases as well as increases) beyond 30-40% for some countries (e.g. Spain, Greece, Lituania, Finland).
Changes in national mean annual gross hydropower potential under a 2°C (cyan) and 3°C (salmon) global warming. Model individual changes are represented by differing symbols: symbols are red when changes are significant at 95%.Author:
Isabelle Tobin
Centre national de la recherche scientifique (CNRS-IPSL), France
