Solar Photovoltaics Potential
Why is the content of this map important?
The Solar Photovoltaics (PV) industry has experienced rapid growth in recent years. The intention is for PV to occupy a significant share in the European energy mix. Changes in climate variables such as cloudiness and temperature can affect the potential for PV power generation, thus such impacts need to be assessed in a context of rapid PV deployment.
Which sectors are affected by this result?
The PV sector, and more broadly the electricity sector, are vulnerable to changes in climate variables, such as solar radiation and temperature. The assessment of changes in PV potential is informative for planning and executing activities in the PV industry. It may also be beneficial for energy-climate policy makers.
What is shown on the maps?
The PV potential exhibits a positive gradient from northern to southern Europe, consistently with the solar resource. According to most models, decreases in mean annual PV potential are highlighted over most of Europe, reaching magnitudes of 5-10% in northern countries. There is an exception in southern countries where changes are not distinguishable from those induced by natural variations in the climate unrelated to greenhouse gas increase. Overall, changes in PV potential are consistent with the pattern of changes in solar resources. However, over southern countries, the projected increase in solar resources is offset by the PV cells efficiency loss due to temperature increase.
Details and further information:
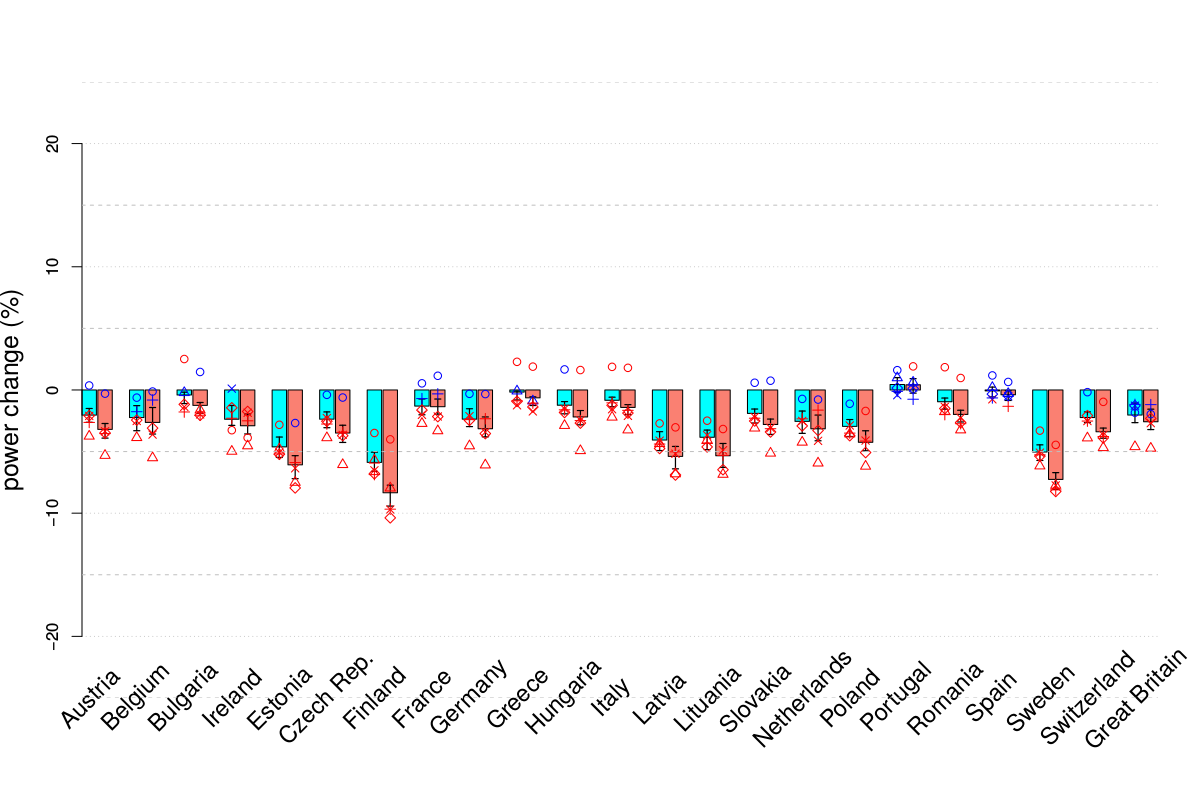
According to most models, the annual power generation potential of PV power plants currently installed will decrease for most European countries (see additional figures). These energy yield losses will however be smaller than 5% in magnitude. A 3°C global warming (salmon color) leads to slightly stronger changes than a 2°C global warming (blue color).
Changes in other factors such as aerosols can also impact PV generation potential and must be studied as well.
Changes in mean annual PV energy yield for the current national PV plants fleets under a 2°C (cyan) and 3°C (salmon) global warming. Model individual changes are represented by differing symbols: symbols are red when changes are significant at 95%.
Author:
Isabelle Tobin
Centre national de la recherche scientifique (CNRS-IPSL), France
