Summer Heat Waves
Why is the content of this map important?
Heat waves are periods of temperature exceeding 5°C above normal lasting more than 5 days. On average, a few heat wave days per year are found in 1971-2000. This number could rise to more than 10d in general in a 3°C warmer climate. Limiting the warming to 2°C would half this increase.
Which sectors are affected by this result?
Heat waves affect a number of economic sectors such as health, energy, agriculture, and they also affect ecosystems. They increase mortality and threaten harvests, and induce high river temperatures and low flows, which potentially lead to thermal electricity production management issues.
What is shown on the maps?
Figures show the current and future average number of heat wave days per summer. Heat waves will become much more frequent in the future than they were throughout 1971-2000. In most areas the number of heat wave days will increase by a factor of 2 to 10, with a marked increase across Mediterranean areas.
Details and further information:
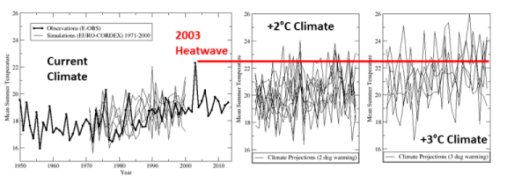
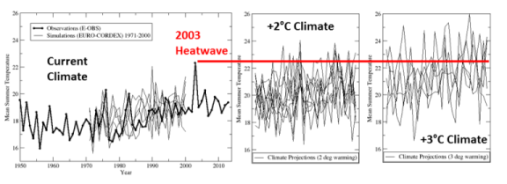
The heat wave that Europe underwent in 2003 is often taken as a reference point for future climate. The figure below shows mean summer temperatures in Central-northern France as observed (E-OBS), simulated and projected (EURO-CORDEX) by an ensemble of models. Summers similar to the 2003 summer were exceptional around 2000. Such summer conditions would be expected to remain infrequent in a 2°C warmer world but become the norm in a 3°C warmer climate.
Author:
Robert Vautard
Centre national de la recherche scientifique (CNRS-IPSL), France
