Agricultural Adaptive Capacity
Why is the content of this map important?
When talking about extreme events, thinking beyond biophysical impacts is important. The vulnerability of people or regions to extreme drought is affected by adaptive capacity; areas high in AC are more likely to cope with and adapt to future changes in extremes.
Which sectors are affected by this result?
Adaptive capacity has implications for crop production (irrigated / rainfed) and the revenues of farmers as well as prices on the regional and global levels. Areas high in AC are more likely to cope with future changes and not be as negatively affected by droughts compared to those less prepared.
What is shown on the maps?
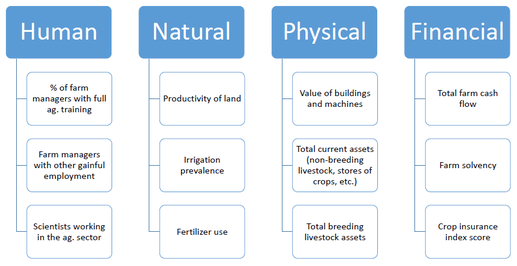
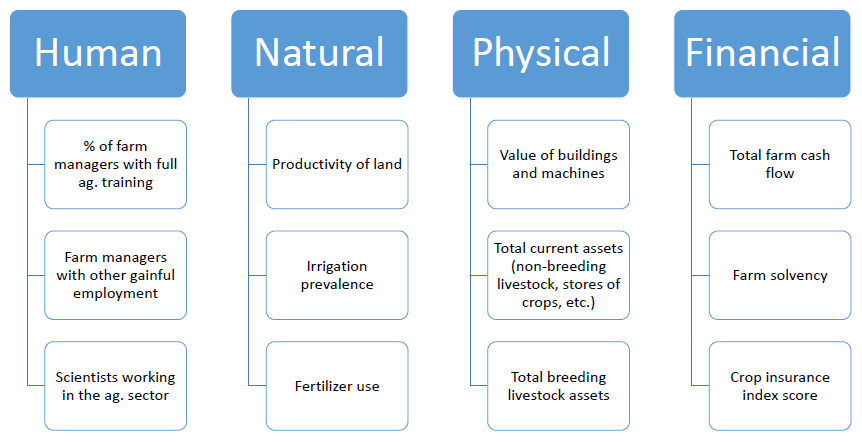
The map shows an index created by adding capital stock indices for human, physical, natural, and financial capitals, with the maximum index value of four and minimum of zero. Each separate capital consists of three indicators of adaptive capacity (AC). The map lets us highlight areas which may be vulnerable now and in the future, by combining our estimates with impacts to create an estimate of vulnerability.
We have portrayed results in line with previous assessments for the global and EU level, aggregating indicators of the capitals to form an index ranging between 0 and 4, with each capital contributing 1/4 to the total value. This measures the ability of the agricultural sector to cope with future changes.
Details and further information:
Below is a simple overview of the indicators used to define each capital stock value for agricultural adaptive capacity. Data were obtained from the EU's Eurostat, the Farm Accountancy Data Network's database, and the World Bank. "Access to and quality of drought insurance" is a categorical value indicating the availability of drought insurance in a country, and whether it is optional or mandatory, and privately or publicly funded and organized.
Breakdown of AC index into component indicators, organized by capital stock typeIndicators were projected to the 2 degree period using a fixed-effects model with GDP, population, and urbanization data inputs from the SSP database.
Author:
Keith Williges
International Institute for Applied Systems Analysis (IIASA)
